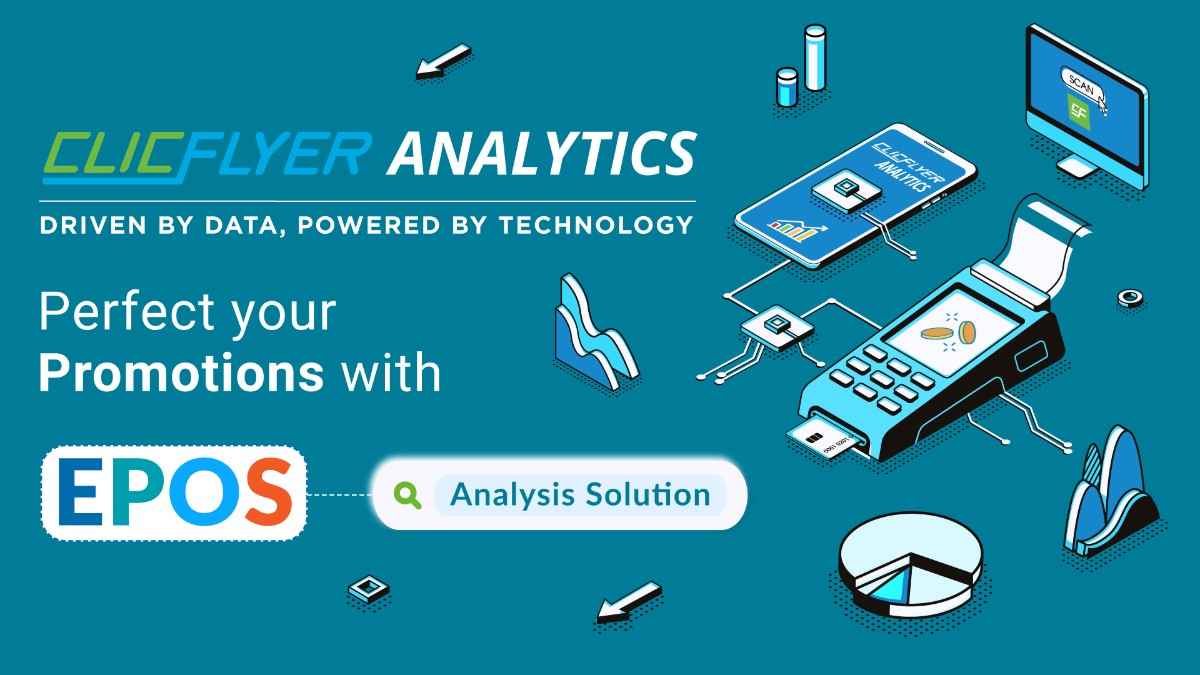
Transform POS Data into Smarter Promotions
The EPOS Optimization Tool is a powerful analytics platform designed to help CPG companies measure the true impact of
flyer-based promotions. By analyzing real-time supermarket sell-out data, it empowers trade and brand teams to make smarter
decisions about packsize, price point, regional focus, and competitive positioning.
Explore, Compare, and Refine — in Real Time

Packsize Drilldowns
Ability to view and compare packsize-level performance across weeks and retailers.

Quarterly Viewports
Enables review of seasonal patterns and promo overlaps to refine future campaign planning.

Sell-out & Engagement Correlation
Visual links between mobile app engagement and EPOS sell-out figures.

Leaflet Vs Instore Promotions
Review Instore Vs Instore campaigns impact on off take to fine tune promotion startegy.
Explore Powerful Features
Promo Effectiveness Analysis
Quantifies impact of flyer promotions on sales by packsize, helping identify which sizes deliver the highest ROI.
Regional Sales Indexing
Highlights underperforming regions and supports decisions on where to intensify promotional efforts.
Price Point Optimization
Identifies ideal average selling price ranges to maximize sales performance during promotional periods.
Promotion Share vs. Sales Share
Compares the volume of promotions run versus the actual sales generated, helping assess promotional efficiency.
Competitor Benchmarking
Benchmarks promotional intensity, price levels, and packsize focus versus competitor brands.
Leaflet Vs Instore Promotion Analysis
Compare sales & market share impact of leaflet promotion weeks vs instore promotions.
Insights That Power Strategic Decisions
by packsize and price range.
cross-brand impact analysis.
by packsize and price.
performance indexing.
across packsize and region.

Tailored for
Every Commercial Team
-
 Marketing Teams can identify which price points and pack sizes perform best under promotion.
-
Sales Teams can prioritize regions with low promotional offtake.
-
Trade Teams can refine flyer strategies based on real sell-out impact.
-
Category Managers can compare performance against competitors to adjust portfolio decisions.
360° Data Integration & Analysis
Pricing Strategies to drive sales & margin

In-store
Promotions
Data
POS
Data
400 Million
Shopper
Interactions
1 Million
Monthly
Leaflets
Ecommerce
Promotions &
Pricing Data
200+
Retailers
CF Solutions - Coverage

KSA

Qatar

UAE

Kuwait

Oman

Egypt

Bahrain

South Africa

Jordan